The overall performance dashboard shows the overall performance of the JobShop.
A time period filter allows you to filter by any time period.
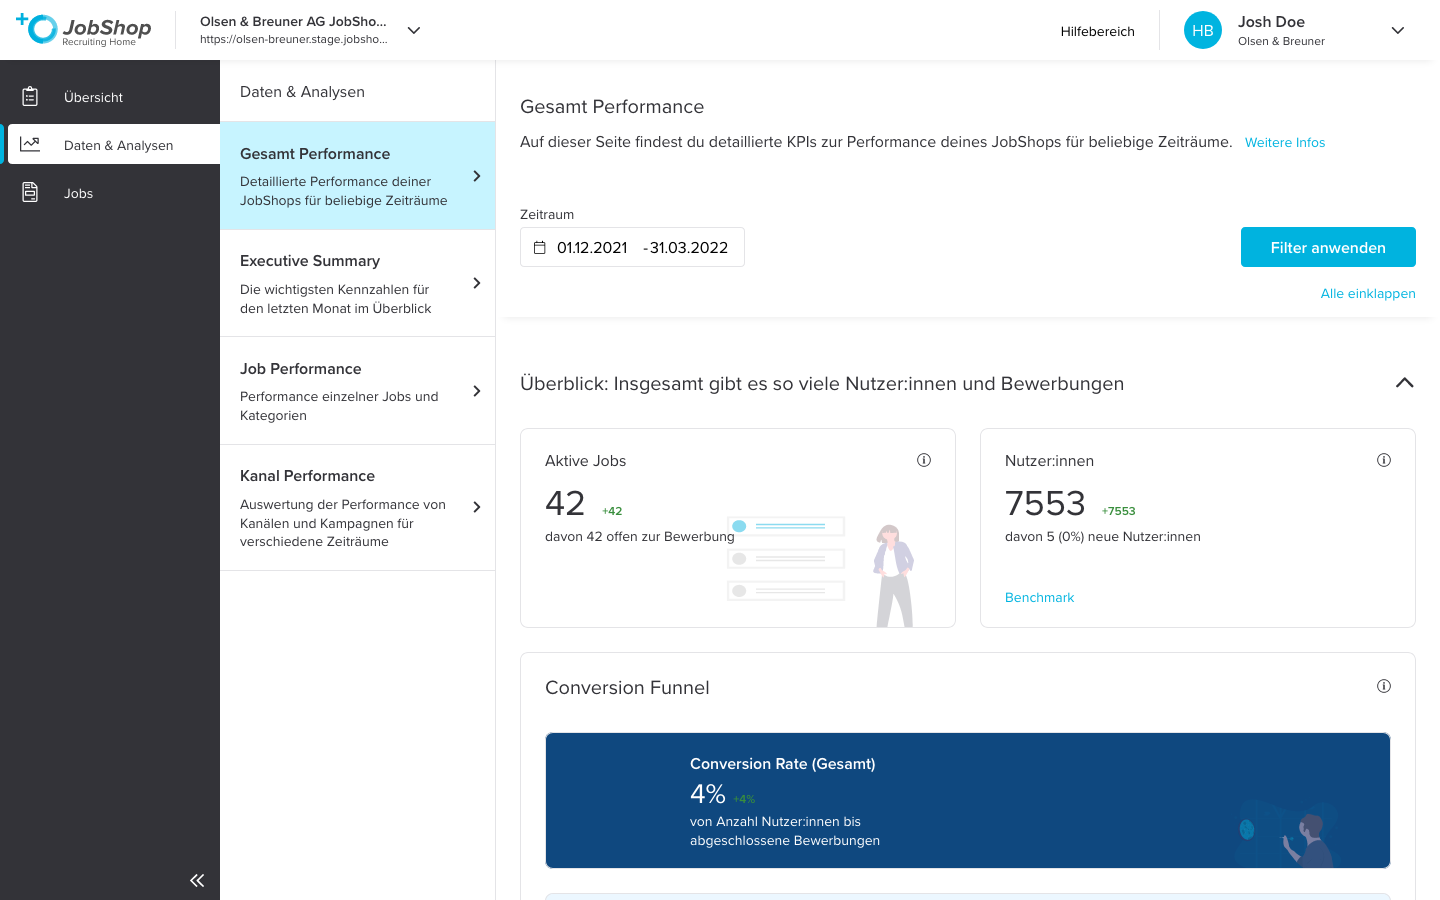
The dashboard contains the following key figures:
- Number of active jobs
- Number of users, incl. benchmark
- Conversion rate with all sub-steps incl. benchmark:
- Number of users who have visited the JobShop
- Number of users who have looked at a job
- Number of users who clicked on Apply
- Number of users who submitted an application via the Fast Application
- Saved "Remember me" contacts incl. benchmark
- Dwell time incl. benchmark
- Bounce rate incl. benchmark
- Pages/visit
- Scroll depth incl. benchmark
- Number of chats incl. benchmark
- Usage per device incl. benchmark
- Starting point of user guidance incl. benchmark
- Top & flop jobs
- Top & flop job categories
- Top channels
Was this article helpful?
That’s Great!
Thank you for your feedback
Sorry! We couldn't be helpful
Thank you for your feedback
Feedback sent
We appreciate your effort and will try to fix the article