The ChatAgent dashboard provides full transparency into your WhatsApp applications – from the first click to the completed application. Use it to measure performance, identify drop-off points in the process, and make informed decisions.
What does the dashboard show?
- Transparency across the entire WhatsApp application process.
- Identify drop-off points and derive optimizations.
- Compare channel performance and avoid wasted budget.
- Track traffic & reach of individual measures.
Filters & Excel Export
Customize your dashboard flexibly to suit your analysis goals.
- Filter by time period, job, source, UTM tags, and more.
- Export data as Excel when needed – ideal for team reporting.
The Applicant Funnel
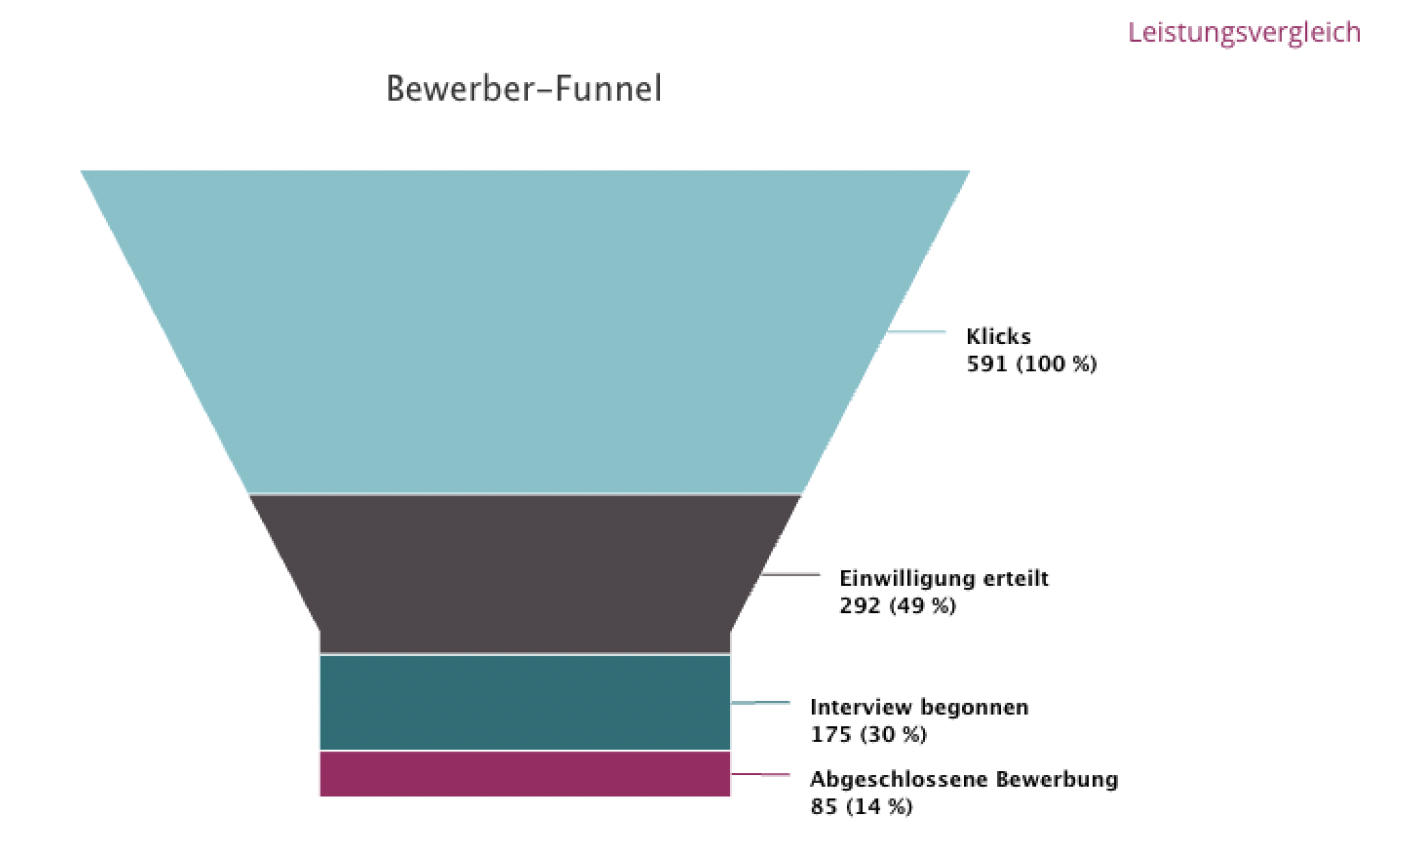
The funnel shows the four phases of the WhatsApp application process and makes drop-off points visible.
1) Clicks
- Views of the disclaimer page before switching to WhatsApp.
- Typical sources: careers page (button), classified ads, social media, QR codes on print materials.
2) Consent given
- Agreement to data processing and use of WhatsApp as a channel.
- This page is continuously optimized by PitchYou (conversion lever).
3) Interview started
- Applicants start the interview with their first WhatsApp message (desktop/mobile).
- There is no direct influence over this metric.
4) Completed applications
- Number of successfully completed applications via WhatsApp.
- Greatest potential as well as risk: questionnaires.
Key KPIs
- Conversion Rate: Share of interviews started that result in a completed application. Average approximately 82 % (benchmark).
- Click‑to‑Apply Rate: Share of clicks that lead to completed applications. Benchmark for ChatAgent approximately 29 % (traditional careers pages often 3–7 %, good pages approximately 9 %).
Performance comparison
- Compare with your own history and with other companies.
- See where you perform better or worse in the funnel.
- Particularly helpful after changes to questionnaires (even small adjustments make a difference!).
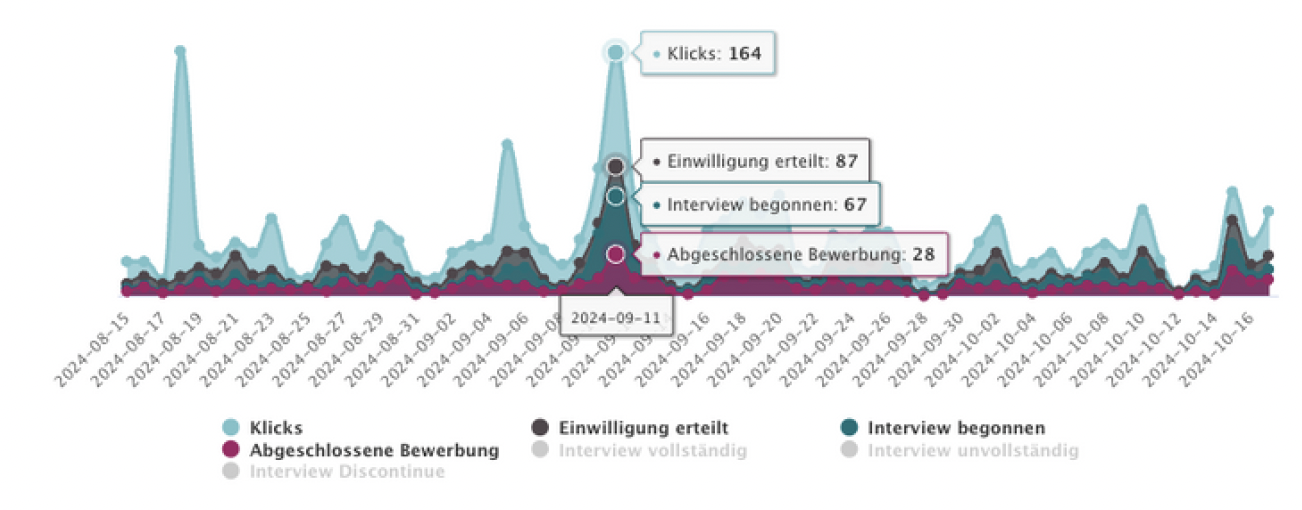
Daily applicant numbers
- Timeline of incoming applications with peaks & dips.
- Use filters to select the relevant day and identify the cause.
Applicant source
Shows which entry points applicants use and which medium is most successful. Tracking links & UTM tags are essential for reliable data.
- Printed materials without an individual QR code.
- Campaigns with a single link – without parameters.
- Business cards, trade fair banners, or posters without a traceable source.
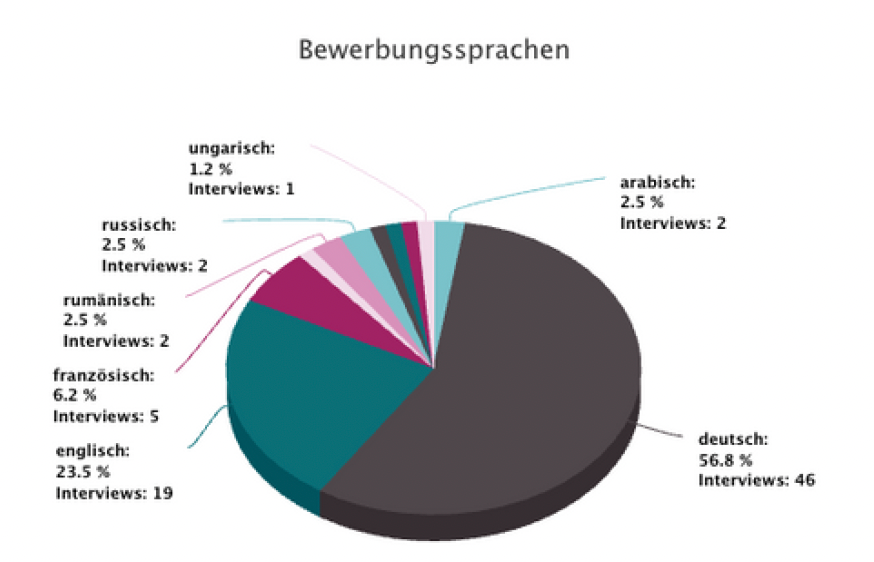
Application languages & age groups
- Provides insight into target groups by language and age.
- Particularly informative when filtering by position or source.
- Check whether your measures are reaching your desired target group.
Next Steps
- Ensure access to the dashboard.
- Set up tracking links & UTM tags for all measures.
- Get an initial overview of key metrics.
- Compare your data with other companies in the dashboard.
- Contact support if you have questions or need optimization.
Checklist
[ ] Access is active and team has access.
[ ] Consistent UTM tags & tracking links used.
[ ] Funnel checked for drop-off points (clicks → completion).
[ ] Questionnaires optimized for length & relevance.
[ ] Performance comparison used (history & benchmarks).
[ ] Peaks in daily applicant numbers analyzed.
[ ] Applicant source tracked cleanly (QR codes & campaigns).
Was this article helpful?
That’s Great!
Thank you for your feedback
Sorry! We couldn't be helpful
Thank you for your feedback
Feedback sent
We appreciate your effort and will try to fix the article